Why hidden anomalies keep slipping past dashboards
A dashboard usually shows the “happy path”: daily totals, averages, and a few red/green thresholds. Hidden anomalies slip through because the break isn’t big enough to move those headline metrics, or it cancels out in aggregation (a spike in one region offsets a drop in another). Even when the signal is real, it can look like normal volatility—especially with seasonality, promotions, releases, or reporting delays.
The other failure mode is alert fatigue. Simple rules tend to fire on routine noise (late files, weekend patterns, known batch jobs), so teams mute alerts or stop trusting them. Once that happens, the system can’t distinguish “ignore” from “urgent,” and subtle fraud, slow outages, or creeping data quality drift can sit in plain sight until a customer or finance report forces the issue.
Spot the anomaly types AI is actually good at
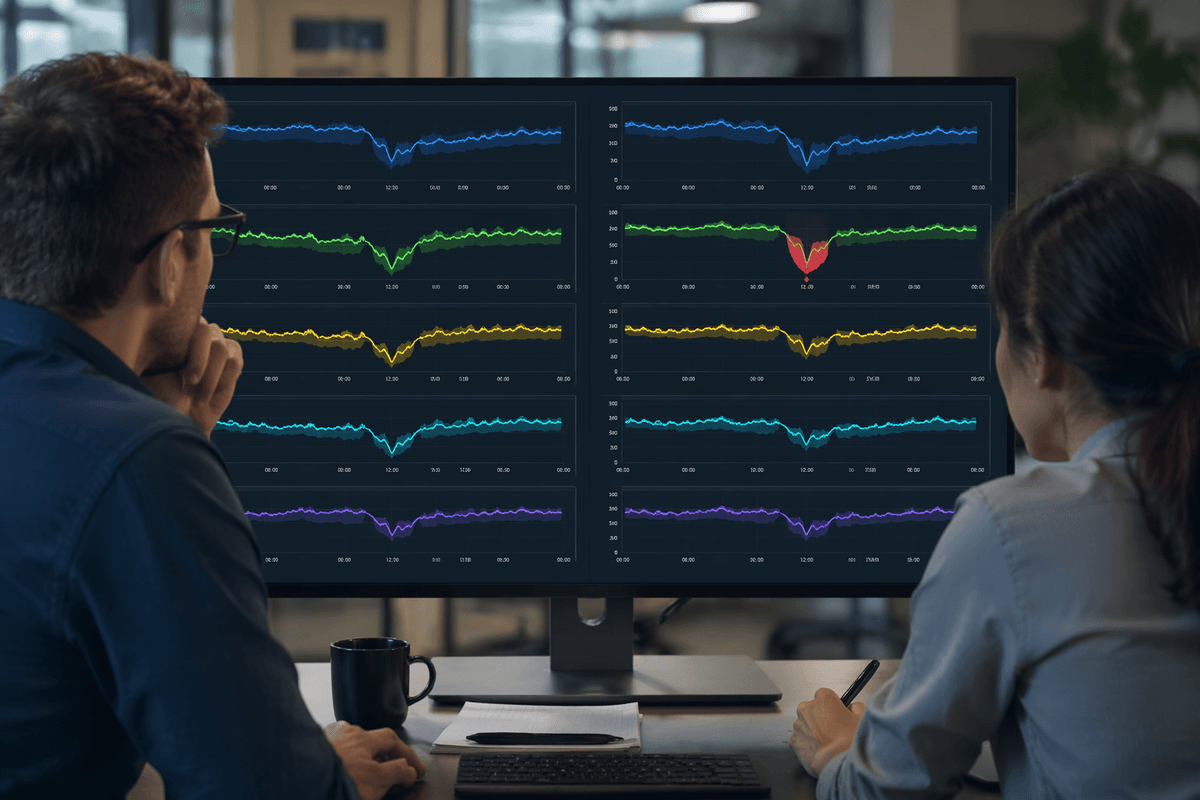
A useful way to judge “AI for anomalies” is by the shape of the problem. It tends to help most when the anomaly is contextual (Monday is fine, but the same dip on a launch day is not), multivariate (each metric looks normal, but the combination is weird), or collective (a run of slightly bad events that matters in aggregate, like a slow creep in latency or refund rate).
It also does well on segmentation that dashboards flatten: a single warehouse, SKU, payment route, or customer cohort drifting while the total stays steady. Another sweet spot is rare-pattern detection, where no single threshold captures fraud-like behavior, but unusual sequences or feature combinations stand out.
These models need clean, consistent inputs and enough history to learn seasonality, and they still produce false positives when the business changes (new pricing, routing, product mix) unless you update baselines and review feedback regularly.
Rules, statistics, or ML—where the baseline breaks down
The familiar pattern is a team adding “just one more” rule: if refunds > X, if latency > Y, if inventory < Z. Rules are cheap and easy to explain, but they assume the baseline is stable. The moment you add new markets, change logging, tweak routing, or run a promotion, the old thresholds turn into noise. You can keep patching, but you’re really maintaining a collection of fragile assumptions.
Basic statistics (moving averages, z-scores, control charts) hold up better when the data is roughly stationary and well-behaved. They break down when seasonality is strong, variance changes by segment, or “normal” depends on context like day-of-week, campaign, or incident state. ML helps when the baseline needs to be learned across many signals and slices, but it costs more: feature work, enough history to learn patterns, and ongoing effort to keep the model aligned with how the business is changing.
What data you need before training anything
Most anomaly projects fail before modeling because the data can’t describe “normal” consistently. You need a stable metric definition (what counts in latency, refunds, sign-ups), a consistent time grain, and enough history to cover the cycles you care about—at minimum several weeks, often a few months if weekly and monthly patterns matter. If you only have daily totals, don’t expect the model to catch a two-hour outage that later “averages out.”
Context fields matter as much as the metric: region, device, warehouse, payment route, SKU, release version, campaign flags, and calendar features. These let the model learn that a spike during a promotion is different from a spike on a random Tuesday. You also need reliable handling for late data, backfills, and missingness; otherwise the detector will repeatedly flag your pipeline quirks.
Finally, keep an incident log or review labels, even if incomplete. Without feedback, you can’t tune false positives, and every alert ends up costing analyst time you didn’t budget.
Choosing an AI approach: supervised, unsupervised, hybrid
A common situation is knowing something is “wrong,” but not having enough confirmed examples to teach a model what “wrong” looks like. Unsupervised methods fit here: they learn patterns of normal behavior from history, then flag deviations. They’re often the fastest start for outages, data quality drift, and novel fraud, but they can be sensitive to business changes and can be harder to explain beyond “this is unusual for this segment at this time.”
Supervised approaches work when you have reliable labels: past incidents, chargeback-confirmed fraud, known pipeline breaks. They’re typically better at prioritization (fewer, more actionable alerts), but the cost is real: labeling effort, changing definitions over time, and class imbalance where “bad” cases are rare. If yesterday’s incidents don’t match tomorrow’s failure modes, accuracy decays quietly.
Hybrids usually perform best operationally: use unsupervised detection to surface candidates, then add lightweight supervision (rules, triage labels, incident tags) to rank, suppress known noise, and improve explainability. Treat the first version as a workflow tool, not an oracle.
Designing alerts people won’t ignore next week
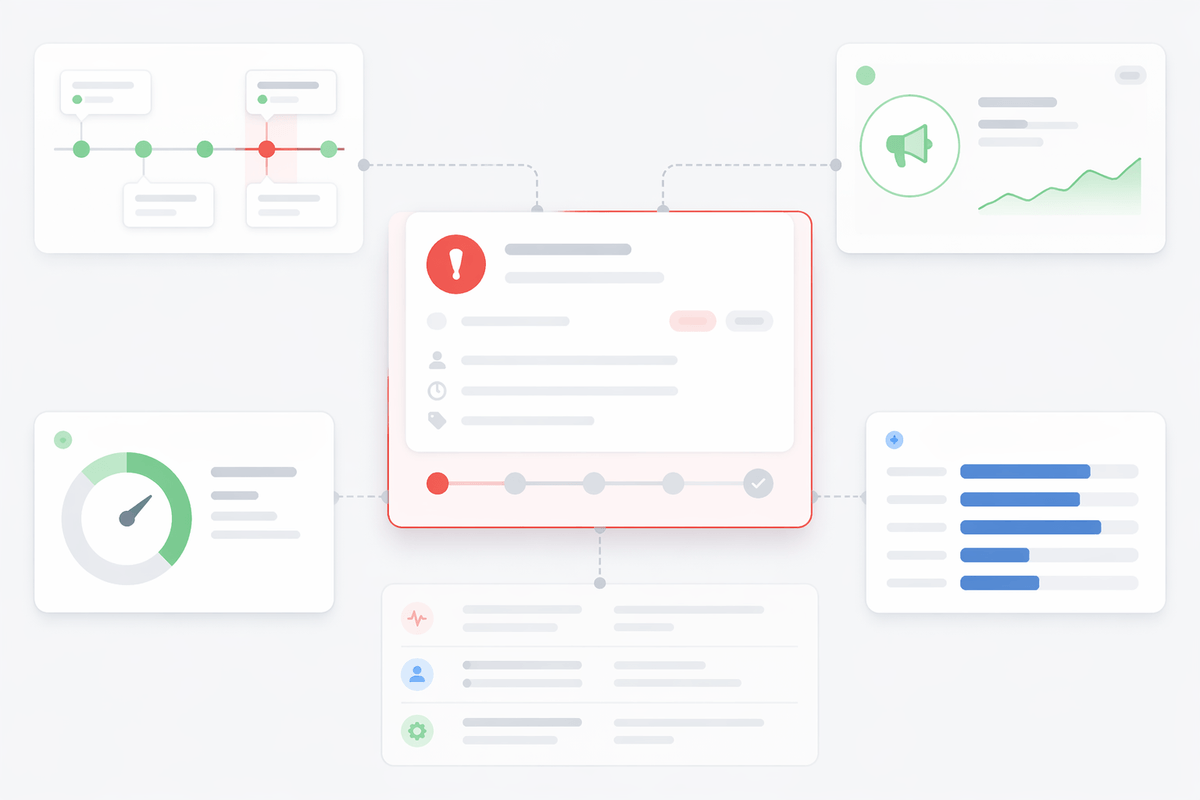
A useful alert feels like a ticket someone can close, not a vague “anomaly detected” banner. That means every alert needs three things: what changed (metric and segment), how big it is versus a learned baseline, and why it might matter (likely impact or a mapped business risk like revenue, availability, or data integrity). Include immediate context in the payload—recent deploys, campaign flags, pipeline freshness, top contributing dimensions—so the first responder doesn’t have to open six dashboards just to confirm it’s real.
Volume control is the make-or-break detail. Set a review budget (for example, 10 alerts/day per on-call rotation) and tune thresholds, ranking, and grouping until you meet it. Group “bursty” alerts into incidents, suppress known maintenance windows, and require persistence (e.g., three consecutive intervals) for noisy metrics. Add a simple feedback loop—acknowledged, expected, actionable, false alarm—and treat analyst time as a real cost you’re optimizing against.
Deployment reality: monitoring drift, retraining, and governance
The first week after launch, the detector will look better than it will a month later. Mix shifts, new product flows, pricing changes, routing tweaks, and logging updates all change what “normal” means, so watch the model itself: alert volume, precision from triage labels, and segment coverage. Track data health too—missingness, late arrivals, and schema changes—because a quiet model can mean a broken input, not a stable system.
Retraining is not a calendar event; it’s a response to measurable drift. Set thresholds for when to refresh baselines, and keep a rollback plan if the new model spikes noise. Governance matters because anomalies trigger actions: document metric definitions, who can change suppression rules, and which alerts page humans. Keep an audit trail of model versions, feature changes, and “why this alerted” details. Without an owner and review cadence, the system degrades into either spam or silence.
A practical starting plan for finding hidden anomalies
Start with one high-impact surface area where misses are expensive: pipeline freshness for revenue reporting, checkout latency, chargebacks, or inventory accuracy. Define 3–5 core metrics, the segments that matter (region, route, SKU, version), and the decision each alert should trigger. Build a baseline with simple seasonality-aware statistics first, then add an unsupervised model to rank “weird combinations” across those slices. Run it in shadow mode for two weeks, tagging alerts as actionable or noise, and cap reviews to a fixed daily budget. Promote only the alerts that consistently lead to a fix, and assign a named owner for ongoing tuning.