Challenging the Data with New Dashboards
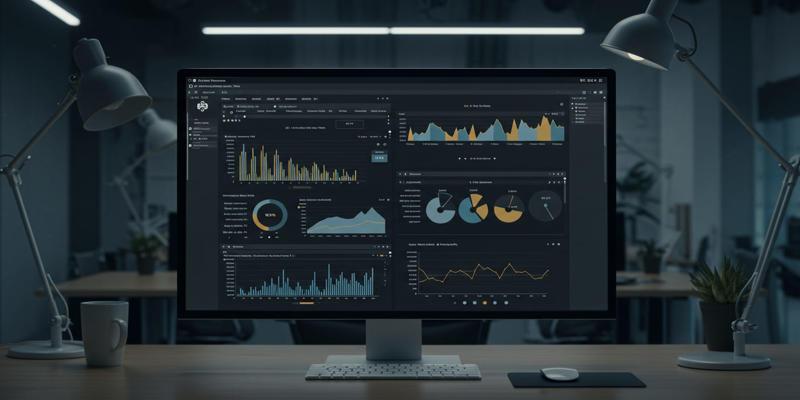
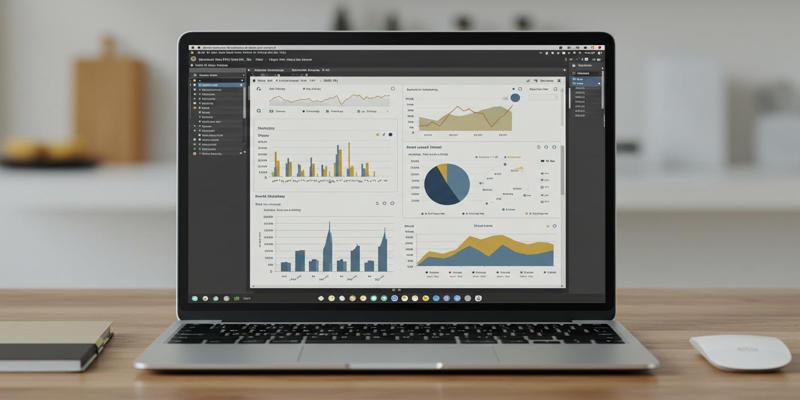 In the era of data-driven decision-making, dashboards represent a crucial data visualization engine to keep track of the key performance indicators (KPIs), monitor and analyze critically important data, and provide fast, actionable business intelligence. One key feature that a good dashboard should possess is that it should not only display information, but also enable interaction, being dynamic, and real, as that makes users engage more and thus stay updated.
We will step through the full process of creating a modern dashboard in Python and Taipy, including setting up and working with data, creating a user interface, interactively working with dashboard components, deploying, and providing real-world examples. By the end of the session, you will learn to build scalable, maintainable dashboards that have unique business and research requirements.
So What Is Taipy?
Taipy is an open-source Python library that aims at empowering developers and data practitioners to design powerful data-driven web pages and apps- including dashboards - with minimal frontend coding. It integrates interface design via declaration and back-end data computation into a unified framework.
The main features of Taipy include the following:
- Declarative UI design: construct dashboard layouts and define components with simple Python constructs and without JavaScript or CSS.
- Reactive program design: UI elements update automatically when the data or user input has changed, and it shows immediate interactivity by using the reactive programming model.
- Pipeline support: Pipeline integration allows seamless support of data pipeline and machine learning workflow, as well as database queries.
- Deployment - Multiple deployment options: Run dashboards in the local environment, or in servers or clouds, with the support of multiple users SA
- Customizability: Has a rich set of movable slots comprising charts, tables, drop-downs, sliders, and buttons that are customizable and furthermore expandable.
Taipy is simple and powerful at the same time, which allows you to quickly prototype and use it in production.
Why Python and Taipy forr developing Dashboards?
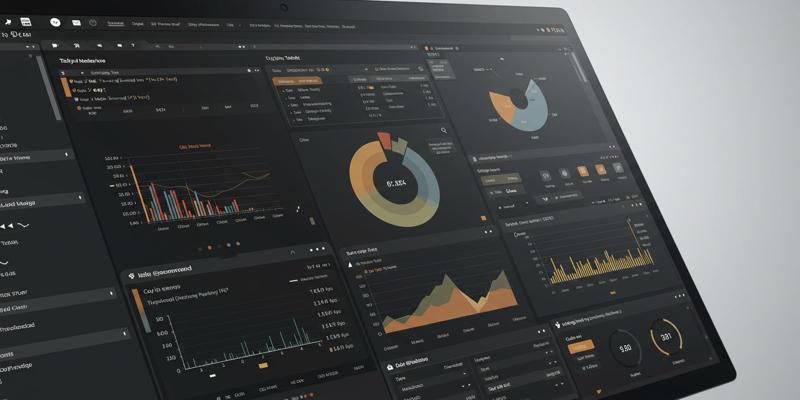 Python is widely used in data science, and has data manipulation and visualization libraries, such as Pandas, NumPy, Plotly,, and Matplotlib. Taipy extends these with UI and application considerations that also tap into the Python ecosystem. Benefits include:
- Single language development: Remove barriers between frontend and backend developers as a whole.. Python development encompasses the building of dashboards.
- Quick development cycles: Iterative design and testing are sped up by declarative UI abstractions.
- High interactivity by default: The Reactive model eliminates the requirement of handwritten refresh-type code.
- Easy extensibility: Add your own components class, or APIs easily, authentication,, and much more.
- Professional support plans: The support package is open-source friendly and suitable for both enterprises and hobbyists.
Step 1: Installing Taipy and Environment Setup
Begin by ensuring that Python 3.7+ is installed on your system. Use pip to install Taipy via the command line:
bash
- pip install taipy
Additionally, install typical data analysis libraries if not already present:
bash
- pip install pandas matplotlib plotly
Configure a modern development environment or IDE for efficient coding and debugging. For visualization and UI interaction, an up-to-date web browser such as Chrome or Firefox is optimal.
Step 2: Organizing your Data Pipelines
The success of any dashboard depends on the data that it presents. taipy focuses on the close integration between the data pipelines and UI:
- Load and preprocess your data with such tools as Pandas. This may involve data cleaning, including cleaning missing values, data aggregation, and computation of key performance indicators (KPIs).
- Necessary to have a data refresh or update mechanism in order to handle real-time or scheduled changes.
- Describe data processes in the form of reusable Python functions or classes that can be executed as needed by Taipy.
- Use Taipy flow or task constructs in the event you need complex chaining or interdependencies between steps.
As an example, one might read in the monthly sales data, filter data on regions, and calculate the growth rates, which could be put in the pipeline so that the steps are directly linked to UI events.
Step 3: Dashboard layout Design
With Taipy,, you can declare dashboard pages using Python strings or components. You are able to create all sorts of widgets:
- Charts: Line, bar, pie, scatter, and heatmap charts to summarize the data by graph.
- Tables: The ability to view the data sets in detail and sort through them.
- Filter Controls: The filter controls are in the form of dropdown menus, sliders, check boxes, and text boxes that are able to dynamically filter and select parameters.
- Triggers: Stimulate data reloads, exports, or navigation.
Step 4: Data and linkage of the user interface
To render dashboards dynamic
- Bind Python data structures or functions to widgets.
- Make the relationships reactive so that any updating in the UI input is reflected in the data (charts or tabular form).
- Respond to logic changes to update the data and notify the component update whenever it is hit by a button click or an input change.
An example is the stock chart that contains a dropdown list of regions; the sales data underlying the chart is filtered by your choice in the dropdown without you having to update the chart manually.
This symbiosis of data and UI is at the heart of Taipy's reactive experience.
Step 5: Testing of Your Dashboard
Be sure to do thorough testing to make sure that your dashboard is responsive to the needs of users and that it functions reliably:
- Test interactivity and responsiveness of interactive features.
- Analyse the accuracy of data using multiple combinations of filters.
- Make cross-browser.
- To determine the bottlenecks, profile load times.
- Test with the stakeholders the user acceptance tests to test usability.
Taipy also has an easy-to-use development server, which makes local testing easy, and logging and debugging capabilities are helpful to resolve problems.
Step 6: Deployment of Dashboards
After testing, look at deployment among the alternatives based on your audience's needs and scalability requirements:
- Local Deployment: Making it easy with simple startup scripts and things that are locally available.
- On-Premise Servers: Have the software installed in the company's hosts to have control of access.
- Cloud Deployment: Deploy Docker containers or PaaS solutions such as AWS, Azure, or GCP to access the web at scale.
- User Management and Security: Enforce multi-factor authentication and HTTPS in case of sensitive dashboards.
Taipy allows multi-user sessions and simultaneous interaction and is thus enterprise-ready.
How to apply Python and Taipy dashboards in the real world?
Sales Monitoring: Visual representation of product performance based on geographical and time-based filtering.
Industrial IoT: Real-time monitoring of data collected by factory sensors and detection of anomalies.
Healthcare analytics: interactive patient dashboards tallying vital statistics and outcomes.
Finance: Risk visualization of portfolios, the use of scenario simulations.
Education: Tracking student performance, equipping it with a correlation with the curriculum and attendance.
Conclusion
Taipy represents a more modern, Python-first paradigm of rapid and scalable dashboard development that is well adapted to data-intensive problems of the current era. Its consumption of clean declarative UI together with Python-driven data pipelines helps it bridge gaps between engineers, analysts, and decision-makers.
Whichever analytics solutions you develop internally to share with others or externally with customers and research participants, the power of ease, interactivity, and scalability in Taipy will help you make smarter, faster decisions with data.
To create dashboards that not only info,, we need to embrace Python and Taipy to create dashboards that not only inform but also engage, delight, and drive impact at every level of organization.